2015 The Hottest Year on Record
On January 20, 2016, scientists from NASA and the National Oceanic and Atmospheric Administration (NOAA) released their analyses of surface temperatures for the past year.
The NASA team found that globally averaged temperatures from January through December 2015 were 0.87 degrees Celsius (1.57° Fahrenheit) above the norm (defined as a 1951–1980 base period). The previous record—set last year—was 0.74°C (1.34°F) above the norm. For the planet, 2015 was more than a full degree Celsius (1.8°F) warmer than temperatures in 1880, when consistent record-keeping began.
Working independently, NOAA researchers found 2015 to be 0.90°C (1.62°F) above the 1901–2000 average. According to their analysis, 2015 was the second warmest year on record for the continental United States, Africa, and Europe. It was the warmest year for Asia and South America. Globally, new monthly temperature records were set in every month except January and April.
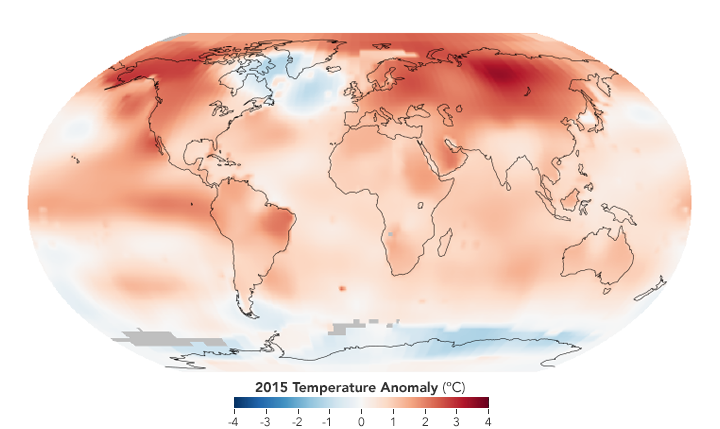
The map above depicts global temperature anomalies in 2015. It does not show absolute temperatures, but instead shows how much warmer or cooler the Earth was compared to a baseline average from 1951 to 1980. The team from NASA’s Goddard Institute for Space Studies (GISS) assembles its temperature analysis from publicly available data acquired by roughly 6,300 meteorological stations around the world; by ship- and buoy-based instruments measuring sea surface temperature; and by Antarctic research stations. This raw data is analyzed using methods that account for the varied spacing of temperature stations around the globe and for urban heating effects that could skew the calculations. For more explanation of how the analysis works, read World of Change: Global Temperatures.
The 2015 temperature record continues a long-term warming trend that has largely been driven by increased carbon dioxide and other greenhouse gases that humans have emitted into the atmosphere. Most of the warming has occurred in the past 35 years, with 15 of the 16 warmest years on record occurring since 2001.
Phenomena such as El Niño or La Niña, which warm or cool the tropical Pacific Ocean, can contribute to short-term variations in global average temperature. The graph below shows temperature trends in relation to El Niño and La Niña events. Orange bars represent global temperature anomalies in El Niño years, with the orange line showing the trend. Purple bars depict La Niña years, and the purple line shows that trend. Neutral years are shown in gray, and the dashed black line shows the overall temperature trend since 1950.
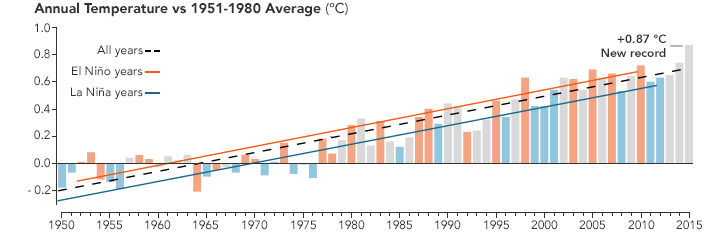
Note that while El Niño conditions dominated the Pacific Ocean for most of 2015, it was not officially an El Niño year in strict climatological terms because ocean conditions did not manifest themselves until April 2015. In the past, the highest global temperature records were often set in El Niño years, which suggests that 2016—with El Niño going strong as of mid-January—appears likely to be another very warm year.
“2015 was remarkable even in the context of the ongoing El Niño,” said NASA GISS Director Gavin Schmidt. “Last year’s temperatures had an assist from El Niño, but it is the cumulative effect of the long-term trend that has resulted in the record warming that we are seeing.”
“Climate change is the challenge of our generation,” said NASA Administrator Charles Bolden. “Today’s announcement not only underscores how critical NASA’s Earth observation program is, it is a key data point that should make policymakers stand up and take notice. Now is the time to act on climate.”
Note: these images were revised on January 22, 2016 to reflect the correct ENSO classification.
-
Related Reading
- NASA Earth Observatory (2015) World of Change: Global Temperatures.
- NOAA National Climatic Data Center (2016, January 20) 2015 is Earth’s warmest year by widest margin on record. Accessed January 20, 2016.
- NASA Goddard Institute for Space Studies GISS Surface Temperature Analysis (GISTEMP).
- NASA Earth Observatory (2015, January 16) 2014 Was the Warmest Year in the Modern Record.
- NASA Earth Observatory (2007, November 5) Earth’s Temperature Tracker.
- NASA Earth Observatory (2010, June 3) Global Warming.
NASA images by Joshua Stevens, based on data from the NASA Goddard Institute for Space Studies. Caption by Mike Carlowicz.
Follow Us


FACEBOOK FEED
DEVA in the house at Muir Commons . Come by in person to see the Cool Cars. Join us on zoom!

cooldavis.zoom.us
Check in with the Davis Electric Vehicle Association(DEVA) and Cool Davis at the June 10th DEVA meeting! DEVA meetings are open to all and can be attended in person or online via zoom.0 CommentsComment on Facebook
Thanks to our $17,000 Match Fund Donors the PreFlight, Early Birds, Midday Blue Jays, Afternoon Waxwings and now the Evening Hawks have brought us this point! Now its up to you to take Cool Davis all the way! Swoop in and get those match funds to double your impact now!
Check out the Match Fund and our progress to our $40,000 goal!
www.bigdayofgiving.org/organization/cooldavis
#BDOG2026
Grateful to those Evening Hawks!
Ken Kaplan, Gloria Partida, Frances Andrews, Tracy Tomasky,Lucia Kaiser, Louise Jackson, Joseph Cech, Michele Santoro, Larry Greene, Bernadette Balics, Joy Cohan, Rich & Claire Bradley, Joseph Johnston

0 CommentsComment on Facebook
TWITTER FEED
Don't freak out, there's still time! Please give to help us meet our goal by midnight! #yoloca #bdog2024 #givebig2024 #nightowls https://www.bigdayofgiving.org/cooldavis

Thank you for helping us fly free with your evening donations (not easy in the dark ;) #yoloca #bdog2024 #givebig2024 https://www.bigdayofgiving.org/cooldavis

Yolo we are so close to our Big Day of Giving goal! Thank you for being on the move and helping us make a much needed $40,000 by midnight tonight! #yoloca #bdog2024 #givebig2024 @yolocommunityfdn https://www.bigdayofgiving.org/cooldavis

There's no masking your generosity! Reveal your true colors and support us today for Big Day of Giving! #yoloca! #bdog2024 #givebig2024 #mayisbikemonth https://www.bigdayofgiving.org/cooldavis

We see you midday blue jays (planting those #generosity acorns in our yard)! There's still time to help us grow a beautiful garden together. #bdog2024 #givebig2024 #mayisbikemonth https://www.bigdayofgiving.org/cooldavis
